

I have found Peter Brandt's call on Silver Top in 2011 nothing less than incredible example of trader's discipline and industry insight and would like to share his observations about Silver today. Please visit his blog to find more information and read carefully my legal disclaimer.
What's In Store For Gold In 2015?
Peter Brandt:
Six chart reasons why Silver has bottomed
Credit where credit is due: Congratulations to all Silver bulls who survived one of the most devastating bear markets in history!
Readers of this blog know I have taken a certain pride in rubbing the noses of Silver bulls into one of the commodity market’s most famous bear trends. This has been true ever since I called the top of Silver in April 2011 (see here).
Well, I believe that Silver bulls will now get the last laugh.
By my count, there are at least six technical chart reasons pointing to why the Silver bear is dead.
Reason 1
As shown on the weekly chart, the “big bull” of 2010/early 2011 began at the February 2010 low of 14.65. It is not uncharacteristic in the commodity markets for a big bull move to be completely retraced by the next bear trend. In fact, it is this complete retracement in Silver (among other reasons) that is proof Silver is a RAW MATERIAL COMMODITY ITEM, not a precious metal proclaimed as such by some Spanish king hundreds of years ago.
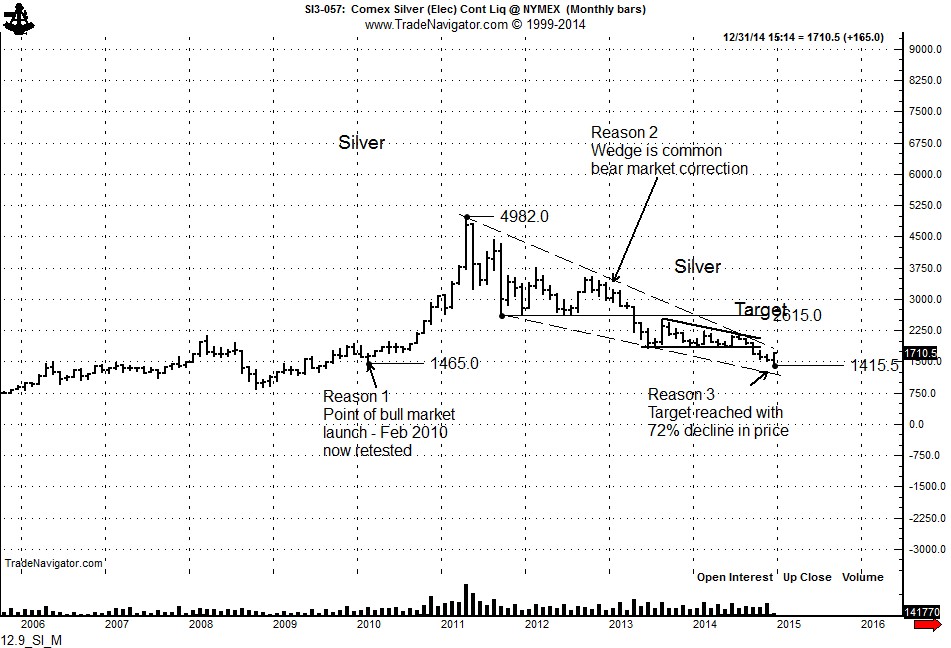
Reason 2
The decline from the April 2011 high has taken the geometric form of a falling wedge. Falling wedges are a common formation to correct a previous bull trend. It must be noted that the completion of a falling wedge seldom results in a “V”-extended bottom. Rather, wedges tend to produce a “backing-and-filling” or “rounding-out” advance.
Reason 3
The decline to the December low finally met the target of the bearish rectangle completed in April 2013.
Reason 4
As shown on the daily graph below, the bottoming that began on October 20 and ended with today’s rally was accompanied by the type of increased volume turnover common to a major low.
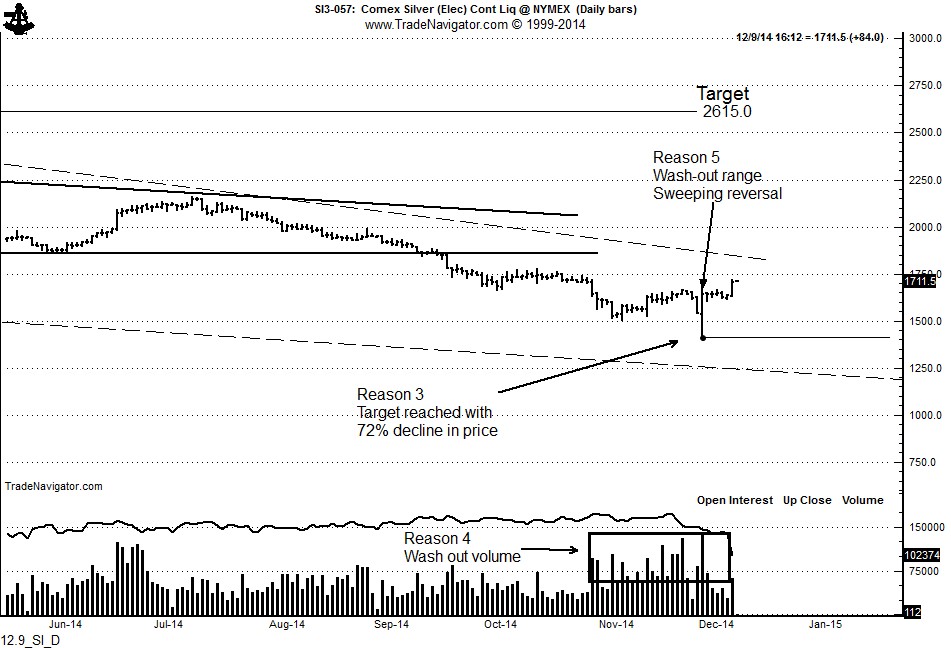
Reason 5
The wash-out low was confirmed by the massive range on December 1. The Silver market on this date rallied 19% of Silver’s value from the low to the high. This type of wide-range wild day often marks an absolute low.
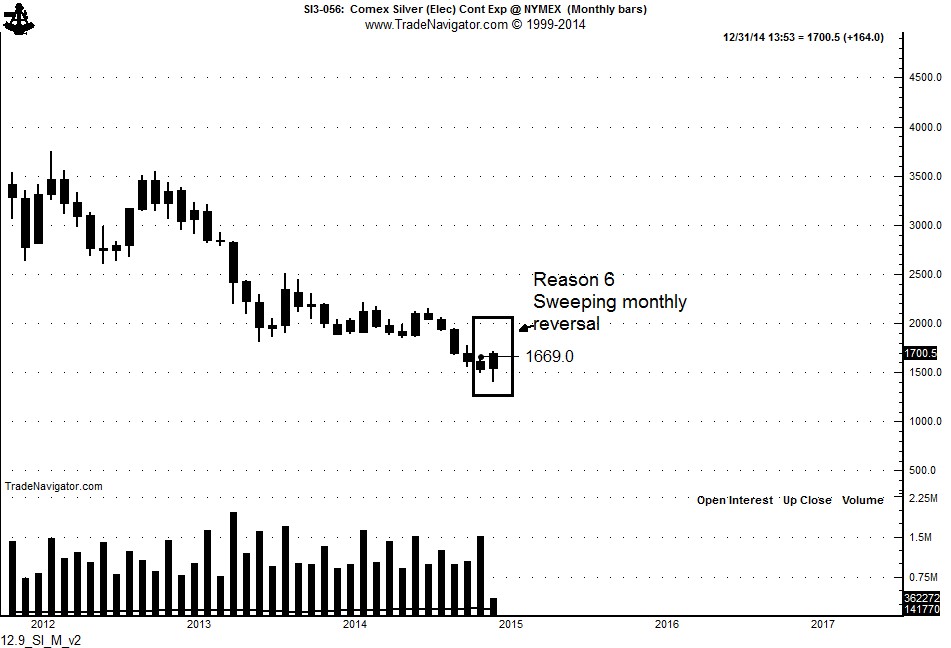
Reason 6
Should prices remain firm throughout December (a BIG IF), the monthly chart will complete a sweeping key reversal — and this is a powerful sign the bottom is in place.
Congratulations, Silver bulls. You survived. I think a logical place for a rally to stop over the next year or so will be a test of the bank of lows on the monthly chart at around $26.
No comments:
Post a Comment